Wazua
»
Investor
»
Stocks
»
How to tell NSE has topped/Maxed out.
Rank: Elder Joined: 11/7/2007 Posts: 2,182
|
flat is a posibility hisah LOVE WHAT YOU DO, DO WHAT YOU LOVE.
|
|
|
Rank: Veteran Joined: 3/26/2012 Posts: 985 Location: Dar es salaam,Tanzania
|
Metasploit wrote:Maybe you can add trendline on the charts;
we have a horizontal trend range on the KCB chart;support at 51-53 from July 2014 and last hit on 18/12/2014 (I bought at 52.50 for shorterm play),and resistance at 60-62 failed to be broken 5 times (Aug,sep,oct,nov 2014)
This implies two things;trend range may continue at least twice with possible lower lows after which we will have a very strong trend change ( a breakout above 62 or a breakdown below 51)
** 52*1.15=60 (15% price difference between support and resistance for the shorterm traders)
CFC stanbic shows the same trend range (support at 118-120,resistance at 127)It has been trying to break above the resistance since June,at the same time support has always been tested (we had price closing at 115 and touching 115 on two occassions).Same script a breakdown or breakout will be strong
** 118*1.12=132 (12% price difference between support and resistance for the shorterm traders)
Equity has been seeing lower lows after hitting the high of 63.
The last low was at 48.50,then 46 and now the price is flirting at 47 and will definately go down.
If the price goes lower than 45,we will set a new support at 50 and this will be a classical head and shoulder pattern
# At this correction cycle,bought centum at 56,KCB at 52.50 and trying KPLC at 13 .
“The pessimist complains about the wind; the optimist expects it to change; the realist adjusts the sails.”
|
|
|
Rank: Veteran Joined: 3/26/2012 Posts: 985 Location: Dar es salaam,Tanzania
|
Metasploit wrote:[quote=Metasploit]Maybe you can add trendline on the charts;
we have a horizontal trend range on the KCB chart;support at 51-53 from July 2014 and last hit on 18/12/2014 (I bought at 52.50 for shorterm play),and resistance at 60-62 failed to be broken 5 times (Aug,sep,oct,nov 2014)
This implies two things;trend range may continue at least twice with possible lower lows after which we will have a very strong trend change ( a breakout above 62 or a breakdown below 51)
** 52*1.15=60 (15% price difference between support and resistance for the shorterm traders)
CFC stanbic shows the same trend range (support at 118-120,resistance at 127)It has been trying to break above the resistance since June,at the same time support has always been tested (we had price closing at 115 and touching 115 on two occassions).Same script a breakdown or breakout will be strong
** 118*1.12=132 (12% price difference between support and resistance for the shorterm traders)
Equity has been seeing lower lows after hitting the high of 63.
The last low was at 48.50,then 46 and now the price is flirting at 47 and will definately go down.
If the price goes lower than 45,we will set a new support at 50 and this will be a classical head and shoulder pattern
# At this correction cycle,bought centum at 56,KCB at 52.50 and trying KPLC at 13 and we HIT the resistance at 59 for KCB and 51 for equity.Safcom also struggling at 14.10,Britam at 31 seeing some good profit taking,co-op doing good sale volumes at 20 etc How low are we going on this cycle ?? 6 times and plus with major stocks trying to break resistances and failing ##stay liquid
“The pessimist complains about the wind; the optimist expects it to change; the realist adjusts the sails.”
|
|
|
Rank: Veteran Joined: 3/26/2012 Posts: 985 Location: Dar es salaam,Tanzania
|
Metasploit wrote:Metasploit wrote:[quote=Metasploit]Maybe you can add trendline on the charts;
we have a horizontal trend range on the KCB chart;support at 51-53 from July 2014 and last hit on 18/12/2014 (I bought at 52.50 for shorterm play),and resistance at 60-62 failed to be broken 5 times (Aug,sep,oct,nov 2014)
This implies two things;trend range may continue at least twice with possible lower lows after which we will have a very strong trend change ( a breakout above 62 or a breakdown below 51)
** 52*1.15=60 (15% price difference between support and resistance for the shorterm traders)
CFC stanbic shows the same trend range (support at 118-120,resistance at 127)It has been trying to break above the resistance since June,at the same time support has always been tested (we had price closing at 115 and touching 115 on two occassions).Same script a breakdown or breakout will be strong
** 118*1.12=132 (12% price difference between support and resistance for the shorterm traders)
Equity has been seeing lower lows after hitting the high of 63.
The last low was at 48.50,then 46 and now the price is flirting at 47 and will definately go down.
If the price goes lower than 45,we will set a new support at 50 and this will be a classical head and shoulder pattern
# At this correction cycle,bought centum at 56,KCB at 52.50 and trying KPLC at 13 and we HIT the resistance at 59 for KCB and 51 for equity.Safcom also struggling at 14.10,Britam at 31 seeing some good profit taking,co-op doing good sale volumes at 20 etc How low are we going on this cycle ?? 6 times and plus with major stocks trying to break resistances and failing ##stay liquid Stay Liquid
“The pessimist complains about the wind; the optimist expects it to change; the realist adjusts the sails.”
|
|
|
Rank: Chief Joined: 8/4/2010 Posts: 8,977
|
Usually a topside signal; inflated small caps is mostly wanjiku's playground. http://www.businessdaily...8/-/jw4jh9z/-/index.html$15/barrel oil... The commodities lehman moment arrives as well as Sovereign debt volcano!
|
|
|
Rank: Elder Joined: 7/21/2010 Posts: 6,192 Location: nairobi
|
Quite some notable green colour today as we await results and div.declaration excitement and there after market takes direction.the banks Q1 will ring the good or bad siren. "Don't let the fear of losing be greater than the excitement of winning."
|
|
|
Rank: Elder Joined: 5/25/2012 Posts: 4,105 Location: 08c
|
Sasini rising as I exit, my dvd in tow. Scan doing 10%. Goodies coming? Pesa Nane plans to be shilingi when he grows up.
|
|
|
Rank: Member Joined: 11/7/2013 Posts: 127 Location: Nairobi, Kenya
|
Pesa Nane wrote:Sasini rising as I exit, my dvd in tow.
Scan doing 10%. Goodies coming? I believe so... I went into the (Ferry) industry knowing the same thing I knew with all other businesses I went into- Nothing. Then I built it from there. - Sheldon Adelson (Titans at the Table- Giants of Macau)
|
|
|
Rank: Elder Joined: 5/25/2012 Posts: 4,105 Location: 08c
|
NSE Market Indicators: 26 Feb 2015
NSE 20 Share Index: 5475.84 => Down 8.07 PointsNSE All Share Index: 175.97 => Down 1.54 PointsFTSE NSE Kenya 15 Index: 231.36 => Down 3.39 PointsFTSE NSE Kenya 25 Index: 231.91 => Down 3.52 PointsTraded Volume: 23.81 Million Shares => Down 57.16%Turnover: Ksh. 896.51 Million => Down 25.30%Market Cap: Ksh. 2.45696 Trillion => Down 0.87%  What just happened? Inflection point?? Pesa Nane plans to be shilingi when he grows up.
|
|
|
Rank: Veteran Joined: 8/16/2009 Posts: 994
|
Mart_Consult wrote:Pesa Nane wrote:Sasini rising as I exit, my dvd in tow.
Scan doing 10%. Goodies coming? I believe so... I expect SCAN to release good results this year. Time is money, so money is time. Money saved is time gained in reverse! Money stores your life’s energy. You expend your energy, get paid money, and store that money for a future purchase made in a currency.
|
|
|
Rank: Member Joined: 7/3/2014 Posts: 245
|
TheGeek wrote:Metasploit wrote:Maybe you can add trendline on the charts;
we have a horizontal trend range on the KCB chart;support at 51-53 from July 2014 and last hit on 18/12/2014 (I bought at 52.50 for shorterm play),and resistance at 60-62 failed to be broken 5 times (Aug,sep,oct,nov 2014)
This implies two things;trend range may continue at least twice with possible lower lows after which we will have a very strong trend change ( a breakout above 62 or a breakdown below 51)
** 52*1.15=60 (15% price difference between support and resistance for the shorterm traders)
CFC stanbic shows the same trend range (support at 118-120,resistance at 127)It has been trying to break above the resistance since June,at the same time support has always been tested (we had price closing at 115 and touching 115 on two occassions).Same script a breakdown or breakout will be strong
** 118*1.12=132 (12% price difference between support and resistance for the shorterm traders)
Equity has been seeing lower lows after hitting the high of 63.
The last low was at 48.50,then 46 and now the price is flirting at 47 and will definately go down.
If the price goes lower than 45,we will set a new support at 50 and this will be a classical head and shoulder pattern
# At this correction cycle,bought centum at 56,KCB at 52.50 and trying KPLC at 13 Price volatility = Traders in the market. I agree on the KPLC also checkout KENGEN. UNGA is also on my radar #67 Posted : Tuesday, December 23, 2014 1:29:48 PM KENGEN @ 9 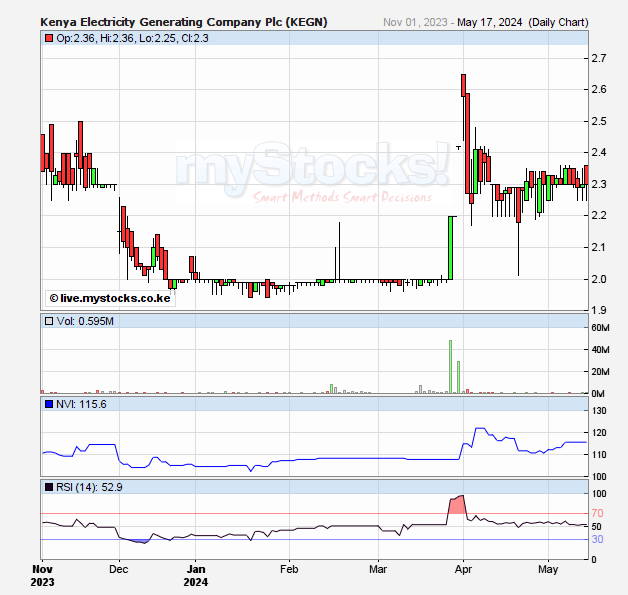 UNGA @ 35 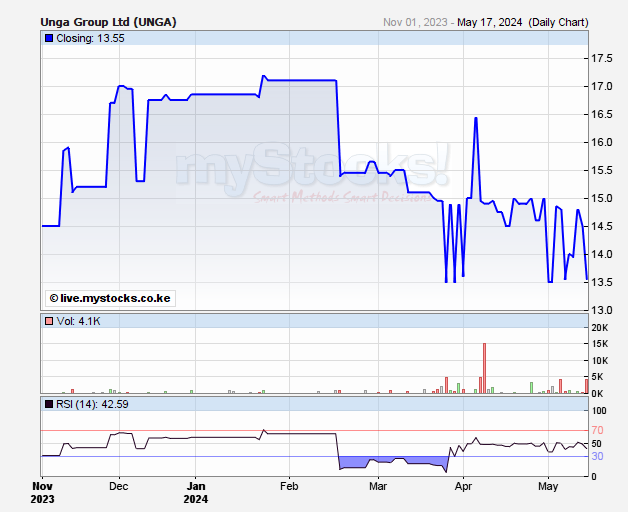 Also lookout for BAMBURI 135-140(For long term) 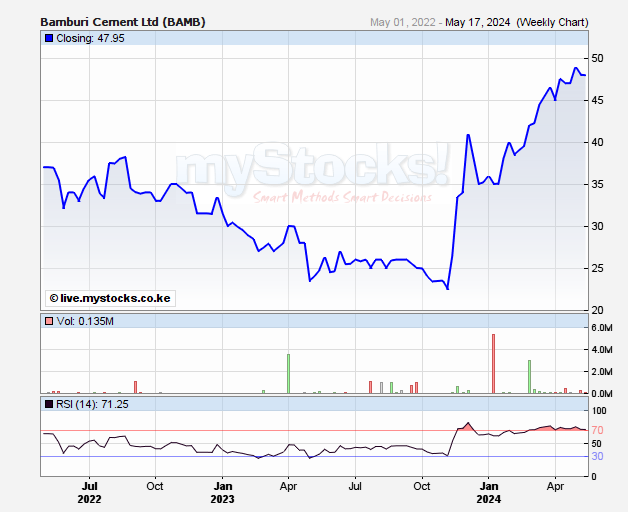 #67 Posted : Tuesday, December 23, 2014 1:29:48 PM #91 Posted : Tuesday, March 03, 2015 10:48:33 AM 1. Scangroup 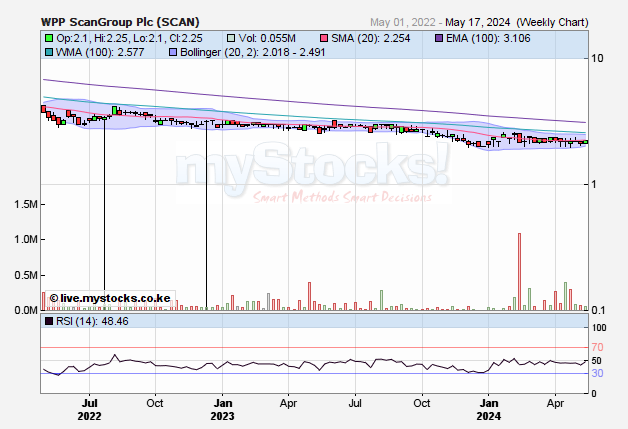 2 KENOLKOBIL 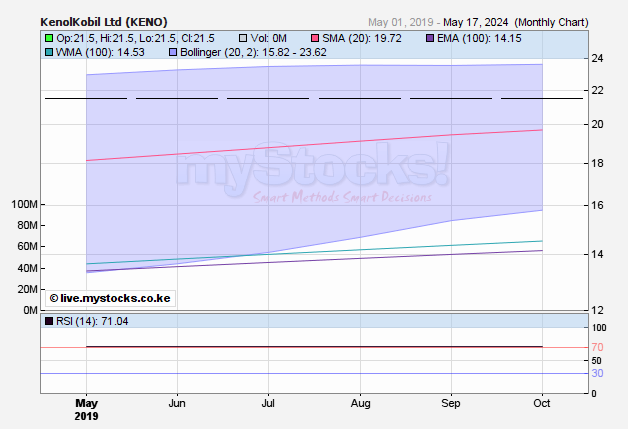 3MPESA BANK 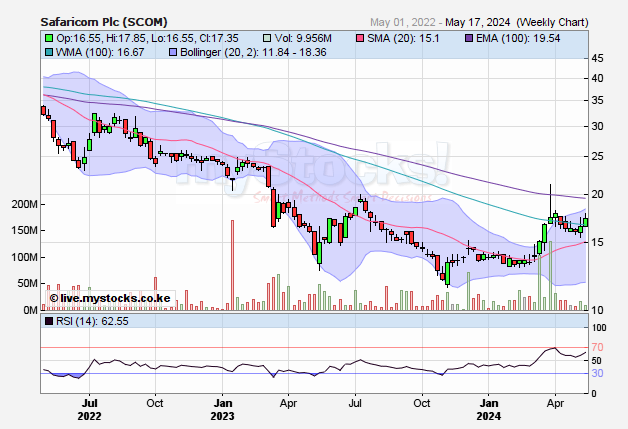 #91 Posted : Tuesday, March 03, 2015 10:48:33 AM @metasploit @mnandii @ hisah @VVS @Philanga what say you ? In the world of securities, courage and patience become the supreme virtues after adequate knowledge and a tested judgment are at hand.
|
|
|
Rank: Veteran Joined: 3/26/2012 Posts: 985 Location: Dar es salaam,Tanzania
|
@ Geek..very interesting picks.I like the volume spike on Scan Group. Please have the RSI column of Scan group in the chart!!
“The pessimist complains about the wind; the optimist expects it to change; the realist adjusts the sails.”
|
|
|
Rank: Member Joined: 7/3/2014 Posts: 245
|
Metasploit wrote:@ Geek..very interesting picks.I like the volume spike on Scan Group.
Please have the RSI column of Scan group in the chart!!
Done. In the world of securities, courage and patience become the supreme virtues after adequate knowledge and a tested judgment are at hand.
|
|
|
Rank: Chief Joined: 8/4/2010 Posts: 8,977
|
TheGeek wrote:Metasploit wrote:@ Geek..very interesting picks.I like the volume spike on Scan Group.
Please have the RSI column of Scan group in the chart!!
Done. I've placed by bet on scan.$15/barrel oil... The commodities lehman moment arrives as well as Sovereign debt volcano!
|
|
|
Rank: Veteran Joined: 8/16/2009 Posts: 994
|
hisah wrote:TheGeek wrote:Metasploit wrote:@ Geek..very interesting picks.I like the volume spike on Scan Group.
Please have the RSI column of Scan group in the chart!!
Done. I've placed by bet on scan. Welcome aboard! Time is money, so money is time. Money saved is time gained in reverse! Money stores your life’s energy. You expend your energy, get paid money, and store that money for a future purchase made in a currency.
|
|
|
Rank: Member Joined: 7/3/2014 Posts: 245
|
Metasploit wrote:@ Geek..very interesting picks.I like the volume spike on Scan Group.
Please have the RSI column of Scan group in the chart!!
You were right after all. A selloff ensued to 44 dipping the rsi to <50 at which triggered some 400k shares to be swapped at 48.(>9% above day low*) In the world of securities, courage and patience become the supreme virtues after adequate knowledge and a tested judgment are at hand.
|
|
|
Rank: Elder Joined: 2/26/2012 Posts: 15,980
|
Simba has broken its resistance of 60/- The volume is amazing "There are only two emotions in the market, hope & fear. The problem is you hope when you should fear & fear when you should hope: - Jesse Livermore
.
|
|
|
Rank: Chief Joined: 8/4/2010 Posts: 8,977
|
Gatheuzi wrote:hisah wrote:TheGeek wrote:Metasploit wrote:@ Geek..very interesting picks.I like the volume spike on Scan Group.
Please have the RSI column of Scan group in the chart!!
Done. I've placed by bet on scan. Welcome aboard! I had loaded up in Feb then in March the EXP merger deal collapsed. That was a nasty surprise to my expectations as it was a major part of the investment equation. I've been selling since Mar 12. The illiquid conditions in this counter make selling or buying such a pain.$15/barrel oil... The commodities lehman moment arrives as well as Sovereign debt volcano!
|
|
|
Rank: Elder Joined: 7/11/2010 Posts: 5,040
|
hisah wrote:Gatheuzi wrote:hisah wrote:TheGeek wrote:Metasploit wrote:@ Geek..very interesting picks.I like the volume spike on Scan Group.
Please have the RSI column of Scan group in the chart!!
Done. I've placed by bet on scan. Welcome aboard! I had loaded up in Feb then in March the EXP merger deal collapsed. That was a nasty surprise to my expectations as it was a major part of the investment equation. I've been selling since Mar 12. The illiquid conditions in this counter make selling or buying such a pain. There's blood on the streets. No one is saying it, but there's alot of blood letting going on... Like you had said, shares are taking a beating, Lets hope its a correction not the bear coming in The investor's chief problem - and even his worst enemy - is likely to be himself
|
|
|
Rank: Elder Joined: 7/11/2010 Posts: 5,040
|
Isn't this the sign of a bull market at its/near peak, where hello's post threads and where pe's of 36 are being tolerated? safaricom at 25.00 threadThe investor's chief problem - and even his worst enemy - is likely to be himself
|
|
|
Wazua
»
Investor
»
Stocks
»
How to tell NSE has topped/Maxed out.
Forum Jump
You cannot post new topics in this forum.
You cannot reply to topics in this forum.
You cannot delete your posts in this forum.
You cannot edit your posts in this forum.
You cannot create polls in this forum.
You cannot vote in polls in this forum.
|